Once upon time, there was a wide and powerful website called Youtube. However, everything was not as perfect as it seemed : some malicious people spread venomous comments... As there seem to have no end to these comments, some people called this website the toxic Rabbit Holes.
In the universe of Youtube
Clustering
Our goal in this part is to compute how tight knit the extreme communities Alt-lite, IDW and Alt-right are. To this end, we’ll define a graph where the nodes represent youtube channels (not necessarily associated to extreme communities) and edges represent their influence on each other. We’ll then compute cluster coefficient to quantify the influence of the channels on each other.
Building a directed weighted graph
To do so, we first defined a bipartite graph where one part represents users, the other part channels, and an edge is drawn between a user and a channel if the user has commented on a video that was published by that channel.

Bipartite graph for the authors and channels for the Youniverse dataset
Then we collapsed the bipartite graph by only keeping the nodes corresponding to channels and drawing an edge between two nodes if they were connected to the same user in the bipartite graph. Since we were interested in how influential channels are, we turned the undirected edges into double directed edges and associated each edge to a weight: the proportion of people who commented on one channel who also commented on the other channel.

Directed weighted graphic example
This way we’re able to quantify influence while taking into account the fact that some channels have more subscribers than others: if channel A is more influential than channel B the edge from B to A would have more weight than the weight from A to B. Now that we’ve defined our graph, we tried to compute two coefficients: their page rank centrality measure and their local clustering coefficient (computed for a directed graph using this paper). The point of computing both the page rank and the local clustering coefficient is that it would allow us to compare how influential a channel is among all other channels versus how influential it is among its local neighbours.
How influential are our extreme communities?
We would expect the channels associated with extreme communities to have a higher local clustering coefficient than the average and a lower page rank coefficient than the average (as we would expect them to be tight knit). We didn’t have time and the resource, and we underestimated the size of our data to compute the local clustering coefficient but we did have time to compute the pagerank coefficient for the whole video set and for the time window restriction.
This is due to the fact that the naive complexity for the referenced local clustering coefficient is O(N3). This can be sped up using faster matrix multiplications but it would still take a long time/cost too much due to the fact that N here represents a channel count (136470). Which is around 1015 naively and 1012 optimized multiply sum computations.
We found an average pagerank coefficient of ~1.10 for the community Alt-right, of ~4.85 for the community Alt-lite and of ~3.20 for the community IDW versus a pagerank coefficient of ~0.48 for the whole channel set.
| Average Pagerank coefficient | Alt-lite | Alt-right | IDW | whole video set |
| ~1.10 | ~4.85 | ~3.20 | ~0.48 |
Table of the average pagerank coefficient of the 4 considered communities
The pagerank coefficient was much higher than we expected. Looking at the distribution of the video’s coefficients, we notice these are exceptionally high values located in the tail.
This would mean that the extreme communities are very active on a much larger number of channels than would be expected.
However, people change so maybe looking at a range of data over several years wouldn’t be the most representative example of the recent state of these communities.
How do our centrality measure vary when we consider a shorter time window?
In a second time we’re only considering comments that have been made between 2018 and 2019 (we would expect if a clustered community is still alive that its members have commented during that time on all the community’s trending channels) and computing the pagerank clustering coefficients on this dataset. We get the following results:
| Pagerank coefficient | Alt-lite | Alt-right | IDW | whole video set |
| 6.12 | 1.43 | 4.01 | 0.43 |
Table of the pagerank coefficient of the 4 considered communities
We notice that these coefficients slightly decreased for the whole video set but considerably increased for the channels associated with extreme communities.This clearly shows that right wing channels rapidly grew in influence on YouTube in the 2018-2019 period compared to 2004-2019. Directly these numbers show that either communities from many other channels started following right wing ones or that there are many more active channels of interest and they share a large amount of audience. In reality it’s probably a mix of both.
In order to properly analyze the source of this rank increase a local clustering coefficient would be needed in order to identify whether there’s a lot more interactions inside the communities of interest or if those communities cross spread into other parts of YouTube.
Discussion
When comparing the two clustering coefficients of extreme communities versus non-extreme communities, we didn’t take into consideration the number of the commentators on each channel. For a more rigorous analysis, we could do a matching based on this number between an extreme community channel and a random video and compute the averages on this set.
When computing our clustering coefficients, we didn’t take into account edges that had a weight of less than 0.01 so there are a lot of channels associated with an extreme community that didn’t get taken into consideration.
Quick summary
We defined a directed weighted graph using youtube channels as nodes and could only compute the pagerank coefficient for each node. We found that the extreme communities had a considerably higher coefficient compared to the whole dataset and that gap difference only increased when we restricted our time window and only took data on a one year interval. This could be consistent with the hypothesis that young people are attracted by far right content and get involved a lot in these communities but hopefully only during a short period of time (not on a long term basis).
Toxicity

Why do we focus on extreme communities?
Some extreme communities are well known for making toxic comments. Taking Trump for example:
Tweet of Donald Trump on Twitter on the 9th of May 2013
But how toxic is that tweet? Thankfully, we’re using a Machine Learning model called
Detoxify
to compute how toxic a sentence is and how severe-toxic, obscene, threatening, sexually explicit,
identity attacking and threatening it is. It rates it on a scale from 0 to 1 (0 not at all, 1 very).
To get an idea, a comment is considered to have a toxic score of 1 if if it is a very ‘hateful,
aggressive, or disrespectful that is very likely to make you leave a discussion or give up on sharing
your perspective’.
For example Trump’s tweet had a score of :
| Toxicity | Severe toxicity | Obscene | Identity attack | Insult | Threat | Sexual explicit |
|---|---|---|---|---|---|---|
| 0.994145 | 0.000296 | 0.004636 | 0.005744 | 0.988292 | 0.000275 | 0.000622 |
Toxicity categories of Trump's tweet
It has a toxicity of ~0.994 and is very insulting (insult~0.988).
To get a better idea of what toxicity score is associated with what type of sentence, we're introducing the monkey scale:
Therefore we wondered if being toxic was one of the characteristic features of extreme communities.
Just as in the study “Auditing Radicalization Pathways on Youtube”
, by Ribeiro et al. (2020),
we decided to study the extreme communities ‘Alt-right’,‘Alt-lite and ‘Intellectual Dark Web’
aka I.D.W and use medias as our control group.
And hopefully twitter isn't the only place where you can be toxic, there is also the
Wonderful ✨ Comment section ✨ of youtube videos.
Key words
In this section, we'll use the terms :
- toxic category : refers to the term toxicity or severe_toxicity, obscene, identity_attack…
- toxic score array of a comment : its array output by Detoxify through all toxic categories.
- toxic category score : the value output by Detoxify for this toxic category
- groups : refers to the 3 extreme communities Alt-lite, Alt-right, IDW and the control group
To study how toxic the comment section associated with a video is, we computed the toxic_score_array of each comment on that video and took their mean category wise. This way, we defined the toxic_score_array of a video. Then we wondered how toxic the comment section of a video associated with an extreme community is .
How does the toxic score array of a video associated with an extreme community compare to the one of a video associated with a media?
When we superimpose the distribution of a toxic category score in an extreme community with
the one in the control group, the one associated with the extreme community does seem to have a
higher score than the control group. Although on a general basis this score is small. Indeed, for
the toxic category ‘toxicity’ we see that in the extreme communities, the proportion of videos
having a high toxicity score is higher than the one of the control group.
But this toxicity is small as they all reach their peak around 0.2 (on the monkey scale,
it would be saying “the annoying monkey made annoying jokes about means”).
For the other toxic categories, we notice that the toxic category score distribution has a
larger proportion of videos associated with higher scores for the toxic categories obscene,
identity_attack and insult. From a first glance, it looks like the Alt-right might generate less
toxic comments out of the three extreme communities.
Although they do not generate so much toxic behavior, there might be a trend where the most popular
videos (that we define as being the most watched) are also the ones generating the most toxic
behaviors. Meaning that although the community might not generate much toxicity, people might go
all out on the most popular videos.
Is the popularity of a video correlated to its toxicity (or to any other toxic category)?
To check if there is a correlation, we plotted a scatter plot of each toxic category score and the view count associated with the video. We also computed the correlation coefficient between the two using Pearson’s (for linear correlation), Spearman’s (for monotonic correlation) and Kendall Tau’s (for class correlation) correlation coefficient and their associated p-values.
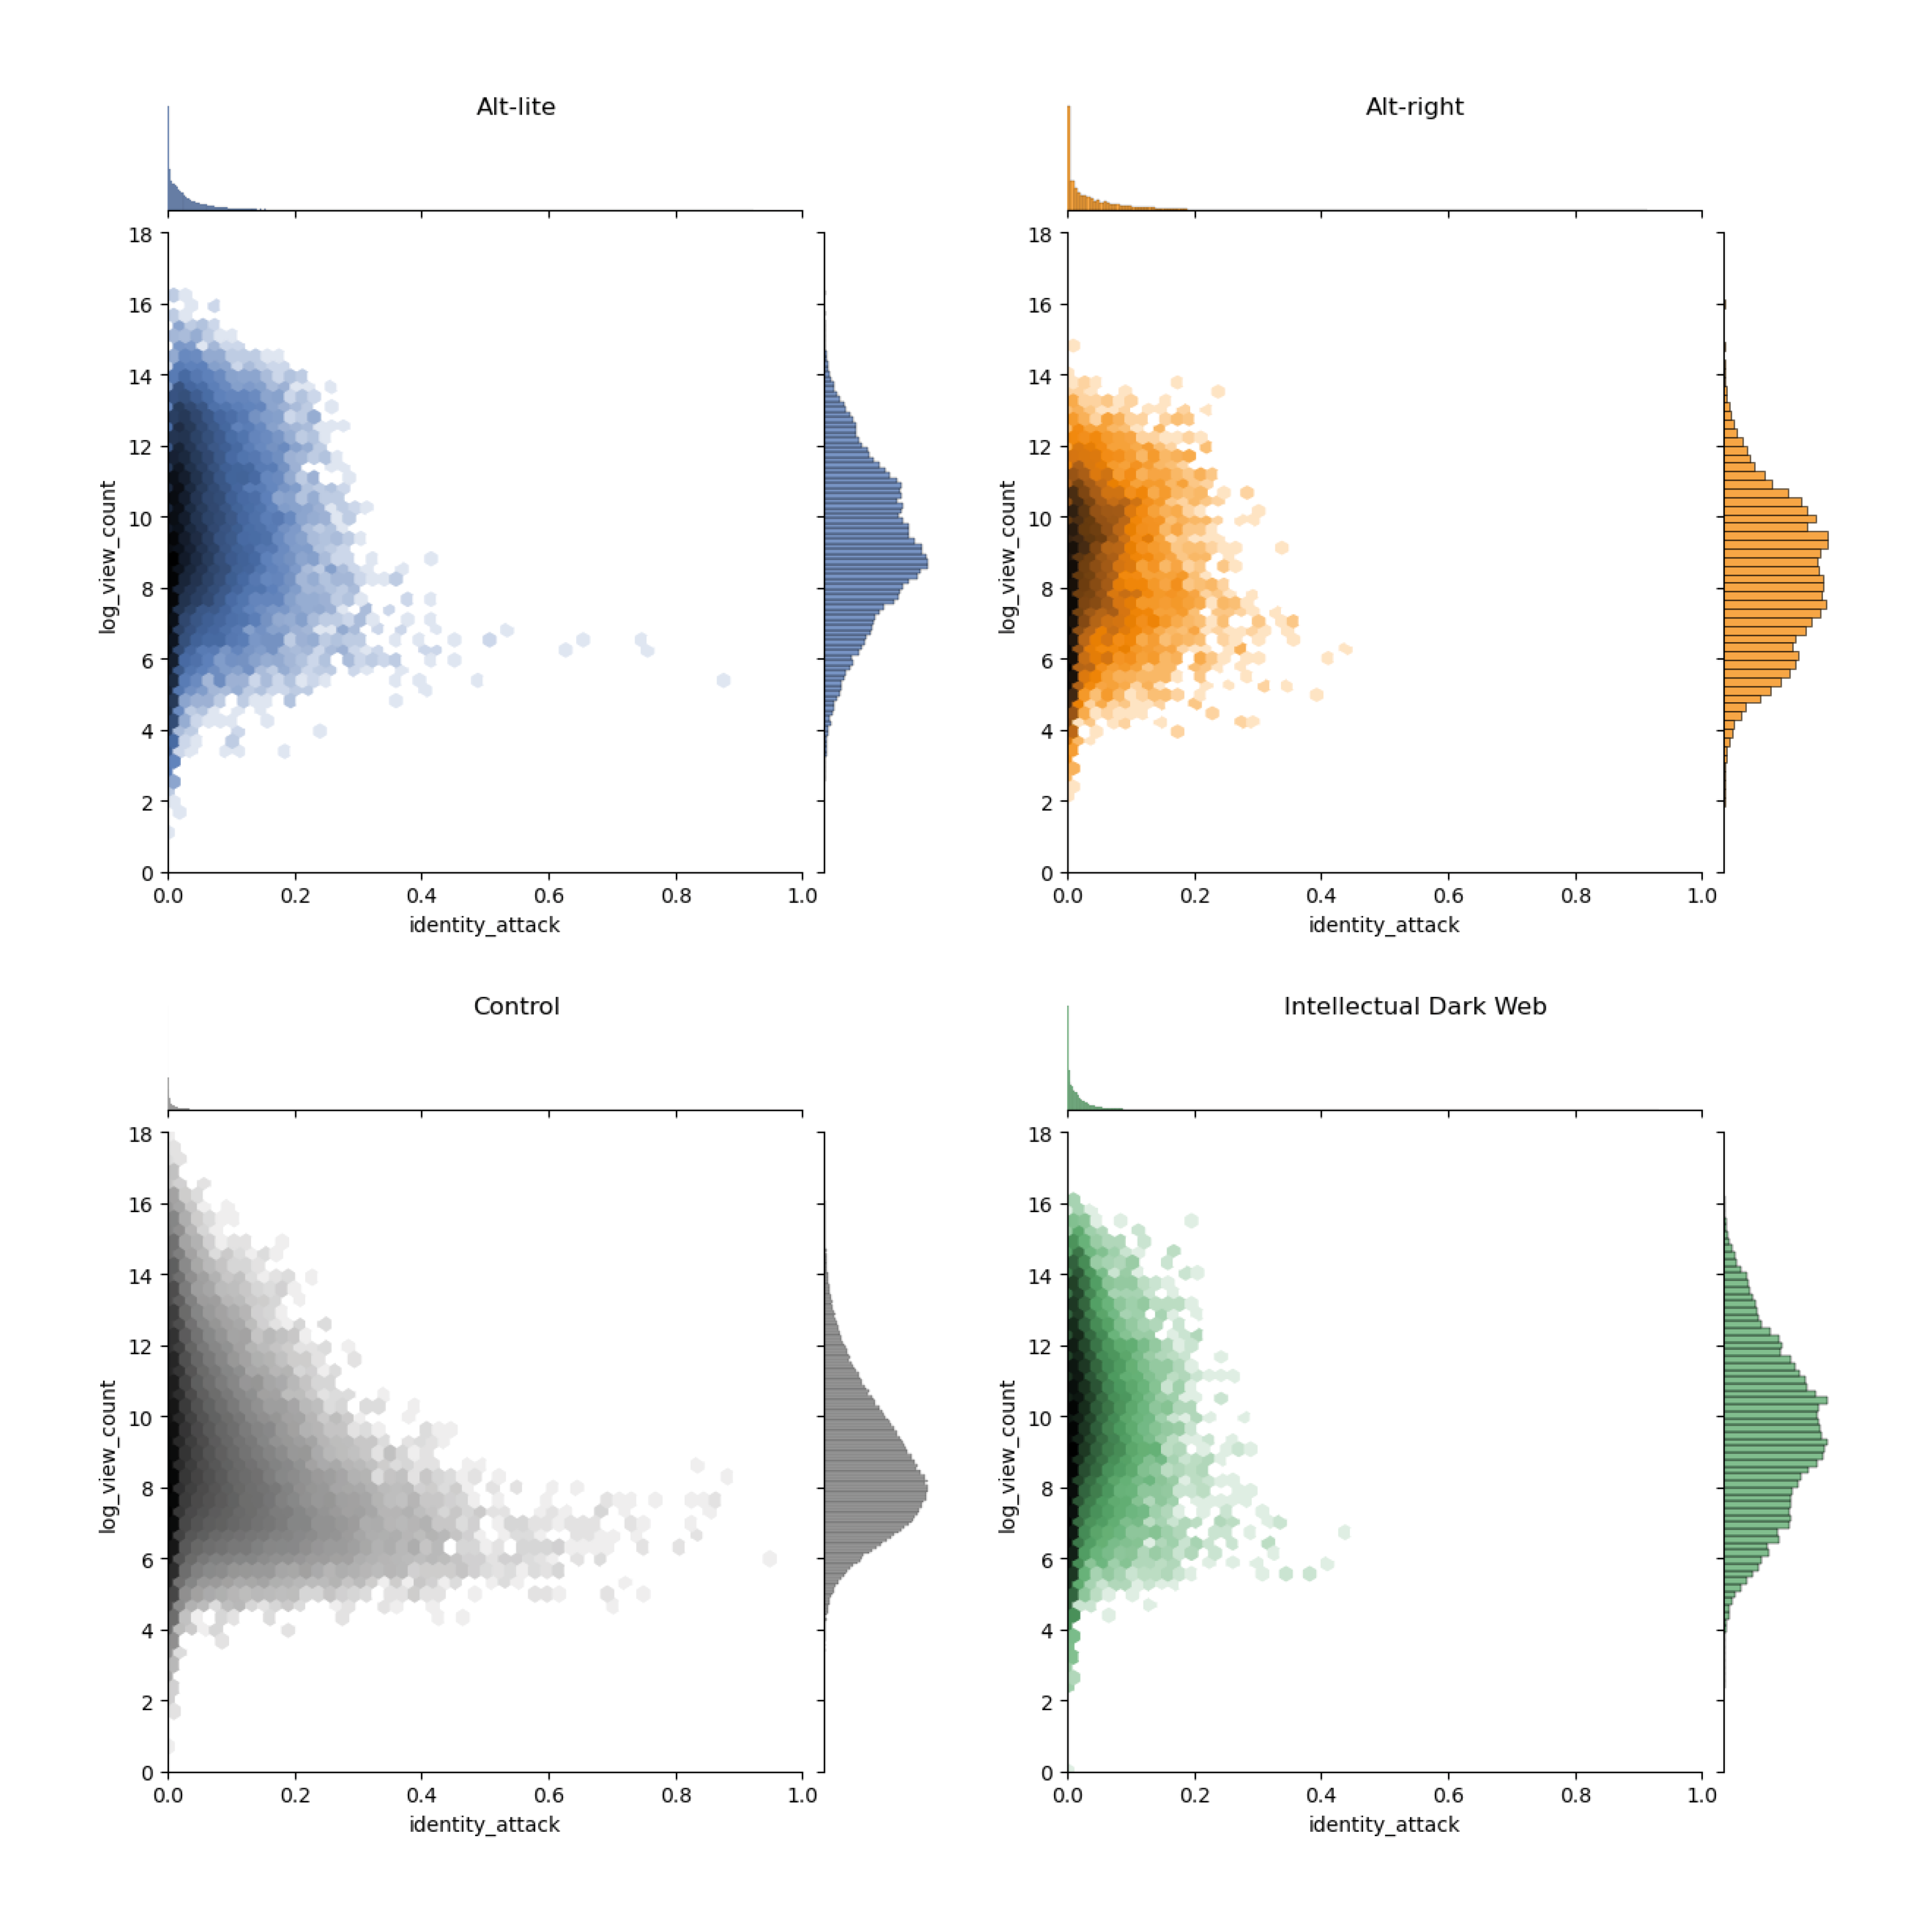
Scatter plot of the toxic category score and the view count associated with the videos.
For the toxicity categories of the channels of the four considered communities, we only take the correlation coefficient if the p-value is inferior to 0.05.
| Alt lite | ||||||
| Toxicity | Severe toxicity | Obscene | Identity attack | Insult | Threat | Sexual explicit |
|---|---|---|---|---|---|---|
| Spearman 0.285 | Spearman 0.512 | Spearman 0.415 | Spearman 0.358 | Spearman 0.287 | Spearman 0.489 | Spearman 0.489 |
Toxicity categories of the channels for Alt lite
| ALt right | ||||||
| Toxicity | Severe toxicity | Obscene | Identity attack | Insult | Threat | Sexual explicit |
|---|---|---|---|---|---|---|
| Spearman 0.204 | Spearman 0.435 | Spearman 0.327 | Spearman 0.306 | Kendall 0.169 | Spearman 0.455 | Spearman 0.422 |
Toxicity categories of the channels for Alt right
| Intellectual Dark Web | ||||||
| Toxicity | Severe toxicity | Obscene | Identity attack | Insult | Threat | Sexual explicit |
|---|---|---|---|---|---|---|
| Spearman 0.272 | Spearman 0.504 | Spearman 0.413 | Spearman 0.384 | Spearman 0.263 | Spearman 0.589 | Spearman 0.506 |
Toxicity categories of the channels for Intellectual Dark Web
| Control | ||||||
| Toxicity | Severe toxicity | Obscene | Identity attack | Insult | Threat | Sexual explicit |
|---|---|---|---|---|---|---|
| Spearman 0.173 | Spearman 0.373 | Spearman 0.339 | Spearman 0.238 | Spearman 0.242 | Spearman 0.352 | Spearman 0.406 |
Toxicity categories of the channels for Control
It turns out that there is either no correlation (among correlation coefficients associated with a p-values less than 0.05, we only have a correlation coefficient of 0.1) or a correlation similar to the one in the control group (ex: correlation of 0.4 between sexual_explicite score and the view count for all 4 groups considered) . However, looking at the scatter plots, we notice that often there is a very large proportion of videos in one exact spot, especially the one corresponding to videos that have a little view count and a little toxic category score. So what would happen if we only looked at the top 25 most seen videos 👀? We’re computing again the scatter plots and the various correlation coefficients.
For the toxicity categories of the videos of the four considered communities, we only take the correlation coefficient if the p-value is inferior to 0.05.
| Alt lite | ||||||
| Toxicity | Severe toxicity | Obscene | Identity attack | Insult | Threat | Sexual explicit |
|---|---|---|---|---|---|---|
| Kendall -0.193 | Kendall -0.127 | Pearson -0.056 | - | Pearson -0.181 | Pearson -0.147 | Spearman -0.152 |
Toxicity categories of the videos for Alt lite
| ALt right | ||||||
| Toxicity | Severe toxicity | Obscene | Identity attack | Insult | Threat | Sexual explicit |
|---|---|---|---|---|---|---|
| Pearson 0.403 | Pearson 0.658 | Pearson 0.555 | - | Pearson 0.457 | Pearson 0.47 | Pearson 0.7 |
Toxicity categories of the videos for Alt right
| Intellectual Dark Web | ||||||
| Toxicity | Severe toxicity | Obscene | Identity attack | Insult | Threat | Sexual explicit |
|---|---|---|---|---|---|---|
| Spearman 0.548 | Spearman 0.587 | Spearman 0.574 | - | Spearman 0.641 | Spearman 0.206 | Spearman 0.576 |
Toxicity categories of the videos for Intellectual Dark Web
| Control | ||||||
| Toxicity | Severe toxicity | Obscene | Identity attack | Insult | Threat | Sexual explicit |
|---|---|---|---|---|---|---|
| Kendal tau -0.133 | - | Pearson -0.158 | Kendal tau -0.133 | Kendal tau -0.147 | Pearson -0.168 | - |
Toxicity categories of the videos for Control
Videos in Alt right and IDW have medium correlation coefficients between their view count and their
toxicity (Alt right has a Pearson’s correlation coefficient of 0.4 and IDW has a Spearman correlation
coefficient of 0.5 and both have associated p-value less than 0.05) and Alt-right and IDW also have a
higher than 0.4 correlation and p inferior to 0.05 for the toxic categories sexual explicit
comments, threat,
insult, obscene and severe toxicity.
Now we can ask ourselves if that trend is only associated with a few videos and is not a channel
trend.
Is the popularity of a channel correlated to its toxicity (or to any other toxic category)?
Again we computed the scatter plots and the correlation coefficients :
In this case, we noticed that all numbers and behavior coincide with the one of the control group
so it is not related to them being extreme communities.
We have noticed that these extreme communities are more toxic than the control group media.
But has it always been the case or is there a trend where comments on youtube videos are becoming
more and more toxic? Already in 2018, Forbes published an article about how social media is becoming
too toxic.
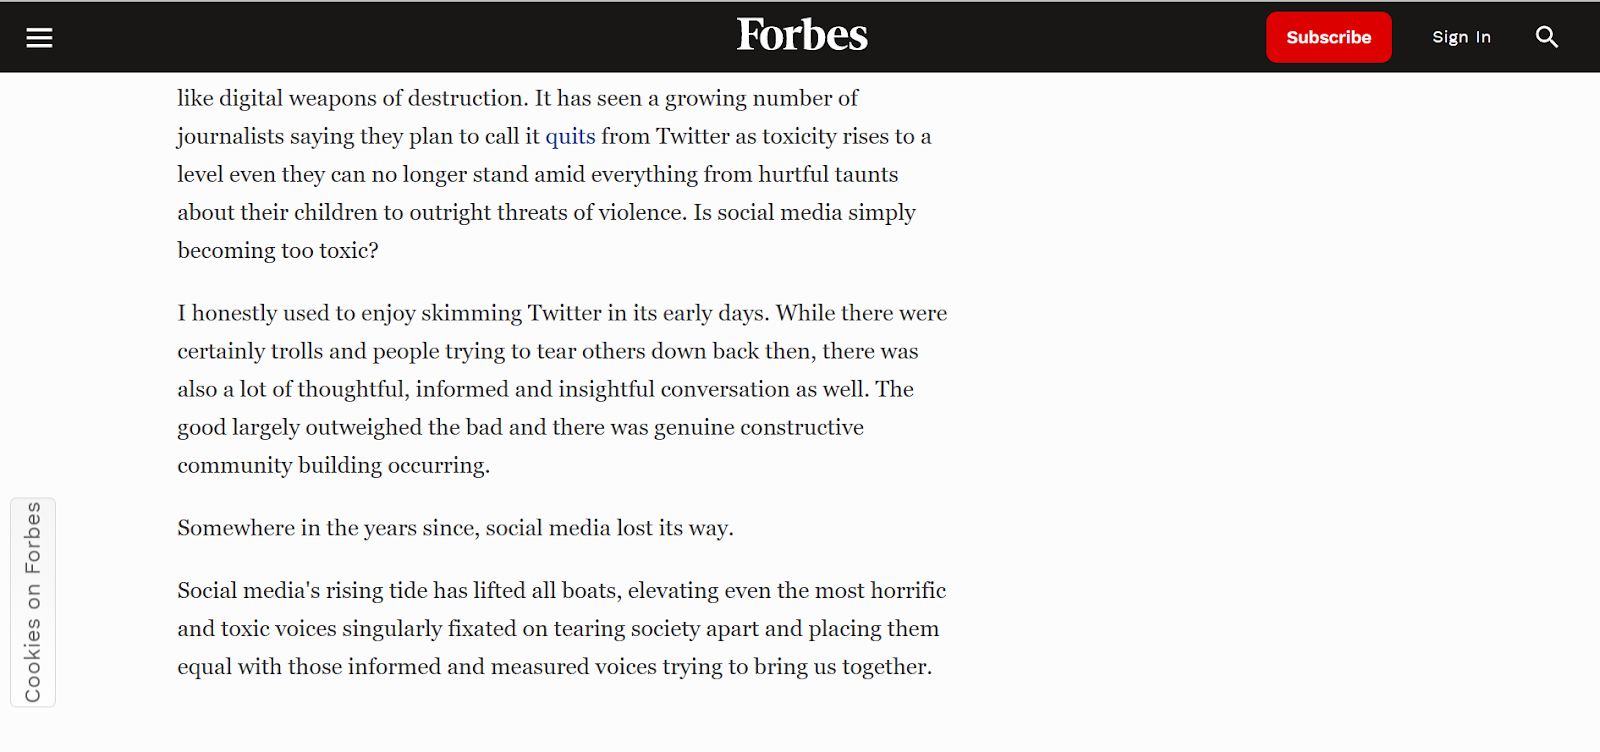
Is social media becoming too toxic ?
This lead us to the following question :
How have the different toxic category scores evolved through time? 🧐
How have the different toxic category scores evolved through time?
By studying data between January 2014 and April 2019, we observe the monthly evolution of the
different toxic categories, among the 4 different groups.
We first compared them to each other:
As before, the subcategories ‘severe toxicity’, ‘threat’ and ‘sexual explicit’
have a very small scale throughout the time so their effect is negligible for each group. Furthermore,
concerning the other toxic categories, the toxic category scores associated with the Alt-lite channel
are generally above the control group, though this is only a difference of max 0.05 point. The
alt-right and IDW communities have usually the same or greater score compared to the control
group. However, the differences are not noticeably high.
We have seen previously that group-wise, some toxic category scores tend to be higher than others,
we’re computing if it has always been the case.
On the graphs, we see that three toxic categories stand out: toxicity, insult and
obscene.
The fact that toxicity stands out makes sense as all the other toxic categories are defined as
‘sub toxicities’ so it makes sense that they have lower scores. However, the fact that among toxic
comments a lot of them are insults or obscene is interesting.
Concerning the Alt-lite community, there is a small constant increase of the three main toxic
categories (mentioned above) until 2018, where a drop is observed (for a hypothesis on this, see
discussion a.). After that, the values are quite stable.
Moreover, a steep increase is observed mid 2016 in ‘toxicity’, ‘insult’ and ‘obscene’
in the Alt-right
community’s comments (for a hypothesis, see discussion b. ????????). We also see a peak in the
first quarter of 2018, however no political events seem to coincide with it.
We saw previously that the 25 most viewed videos per group have a stronger correlation with
each toxic category score than when we considered all the group’s videos. We’re computing how it
reflects in numbers throughout time.
The top 25 videos of the month usually have the same or a noticeably higher mean than the monthly overall mean of their corresponding category.
This is most detectable in the Alt-lite community. However, the reverse
happens in the control group. Indeed, after mid 2015, the most viewed videos are less toxic than the
mean of all the videos.
Moreover, the absolute difference of toxicity in between the top 25 videos of Alt-lite and the control
group is bigger than 0.1, which is an important difference. This difference can also be observed in
other toxic categories, like ‘severe toxicity’, ‘obscene’ , and ‘insult’. The same way
among extreme
communities, Alt-lite is the one for which the difference between the toxic category score of the top
25 and the entire set of videos is the largest.
On a general basis, starting mid 2015, we observe a really different behavior between the control group
and the extreme communities.
Discussion
We could look into the relationship between a video content and toxicity category score of the
associated comment section. By applying Detoxify on the caption of the comments we could study if
there is a correlation between the toxic category score of the caption of a video and the toxic
category score of its comment section.
Do notice that the machine learning model Detoxify has a lot of limits even the unbiased version.
E.g the formulation of a sentence can make the toxicity vary a lot: 'I am at the zoo and I see a
black monkey' has a toxicity of 0.19 and 'I saw a black monkey at the zoo' has a toxicity of 0.06.
The same way, a comment is considered obscene if you use a swear word even in a positive way. For example the sentence “that was fucking brilliant” has an obscene score of ~0.95.
| Toxicity | Severe toxicity | Obscene | Identity attack | Insult | Threat | Sexual explicit |
|---|---|---|---|---|---|---|
| 0.942965 | 0.015987 | 0.953825 | 0.002574 | 0.089621 | 0.000974 | 0.026361 |
Toxicity categories of the associated comment section
This raises the questions:
Can using a swear word hurt someone’s sensibility? Are swear words toxic?
Any mom would obviously say yes....
In further research, we could try to connect the variations in the toxic category scores to
major events. For example for a. a hypothesis to explain why the values have dropped is the #Metoo
movement, starting in 2017 as a way to draw attention on the magnitude against sexual abuse and
harassment. For b. it coincides with the election of Donald Trump in the United States. Indeed, in June
2015, he announced that he would be a candidate in the U.S. presidential election of 2016. In November
2016, he won the election. Also, following the Russian interference in the 2016 U.S. elections,
YouTube didn't initiate any moderation.
In our project we only computed the correlation and didn’t conduct a causality study so this could
be ground for further research.
Conclusion
We found that the extreme communities had a considerably higher coefficient compared to the whole dataset, meaning that the far-right
channels tend to have more activity that the other ones.
It is therefore interesting to look at these communities, and in particular at one of their supposed characteristics: their toxicity.
With this study, it’s possible to have an answer to the question “Is it true that these channels are more toxic than others?”.
Overall on average, videos associated with extreme communities have a higher toxic category score
than the ones associated with the control group but still have a relatively small score (around 0.2).
When looking at the evolution of the toxicity category scores through time per group, we find again
that the absolute differences seem negligible. We could assume some hypotheses about the reasons for
certain decreases and increases but, the toxicity levels did not seem abnormal.
When restricting ourselves to the 25 most seen videos and computing the correlation between the view
count and the toxic category scores, we get correlation scores as high as 0.6 for the extreme
communities Alt-right and IDW. However, when looking at the toxic category scores of the top 25 videos
per month per group, the most important score difference between the top 25 of the control group and
the top 25 of an extreme community is reached for Alt-lite with a score difference of more than 0.1 for
the toxicity. Moreover Alt-lite also has the highest toxic category scores difference between its top
25 videos and its whole video set. This difference could also be observed in other subcategories of
toxicity. This is really interesting as it means that although the top 25 videos of Alt-lite are the
ones generating the most toxic behaviors, it doesn’t seem like generating toxic behavior is something
specific to its most popular videos. On the opposite, for the Alt-right and IDW videos, they generate
less toxic behavior but there is a higher tendency that it would be something specific to popular
videos.
In further research, for more precision we would need to investigate all the edge cases of the machine
learning algorithm Detoxify. Indeed, the scores become abnormally high when a certain biased vocabulary
is used, or when a sensitive couple of words is written together.
Finally, many different aspects of the channels and videos could be studied, in relation to the toxicity of the comments. For example, a study could be led about the existence of a correlation between the toxicity of the comments and the toxicity of the content of videos, i.e. its caption.